
Dashboard
The dashboard answers one question fast: what happened in this workspace over this date range, and which calls need a human to look at them.
What is on the screen
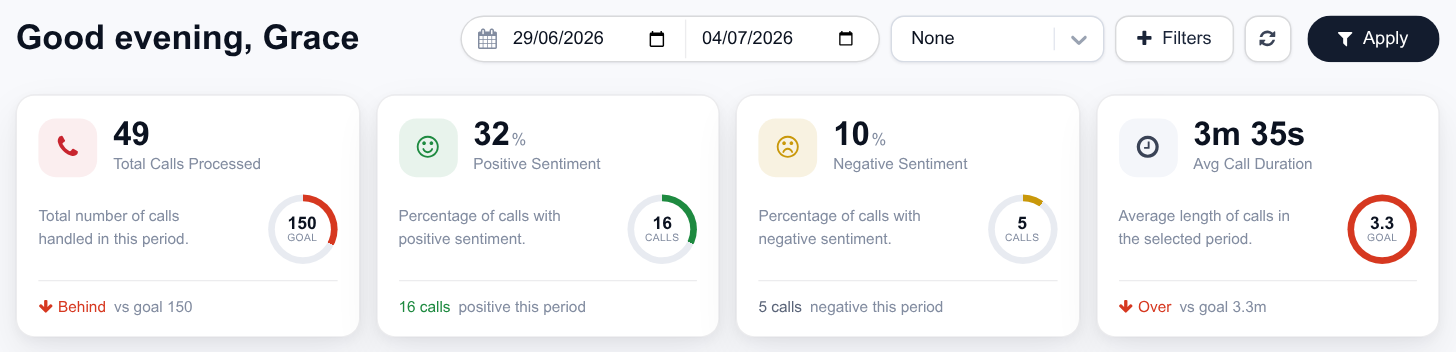
Top to bottom, the dashboard is four bands:
- Toolbar Date range, saved filter, advanced filters, refresh, and Apply.
- KPI cards Total calls, positive and negative sentiment, average duration, each against your workspace goal.
- Charts Sentiment trend, emotion distribution, and calls per agent.
- Recent Calls The call list, with search, bookmarks, metadata tools and pagination.
Workspace and date range
Everything on the dashboard is scoped to two controls. The workspace switcher in the top bar decides whose calls; the From / To date fields decide when.
- The default range is the last seven days.
- Your chosen range is remembered in the browser, so it survives a reload and follows you between screens.
- Change the dates, then press Apply — the KPIs, charts and call list all reload together.
- The refresh button re-runs the current query without changing anything, useful while a batch is still processing.

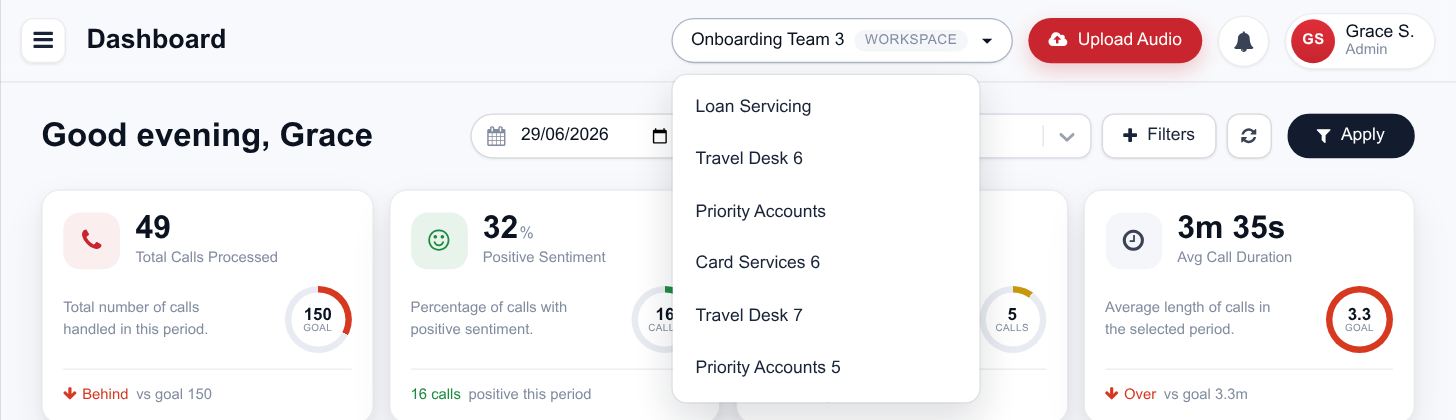

The KPI cards
| Card | What it counts | Ring |
|---|---|---|
| Total Calls Processed | Calls that completed processing in the range. | Progress against your calls per day goal, when one is set. |
| Positive Sentiment | Calls whose overall text sentiment came out positive. | Share of total calls. |
| Negative Sentiment | Calls whose overall text sentiment came out negative — your follow-up queue. | Share of total calls. |
| Avg Call Duration | Mean handling time across the range, in minutes. | Against your average duration goal, when one is set. |

The rings compare against the targets on the workspace. Until you set them (Goals & targets) the cards report raw numbers with nothing to measure against.
The charts
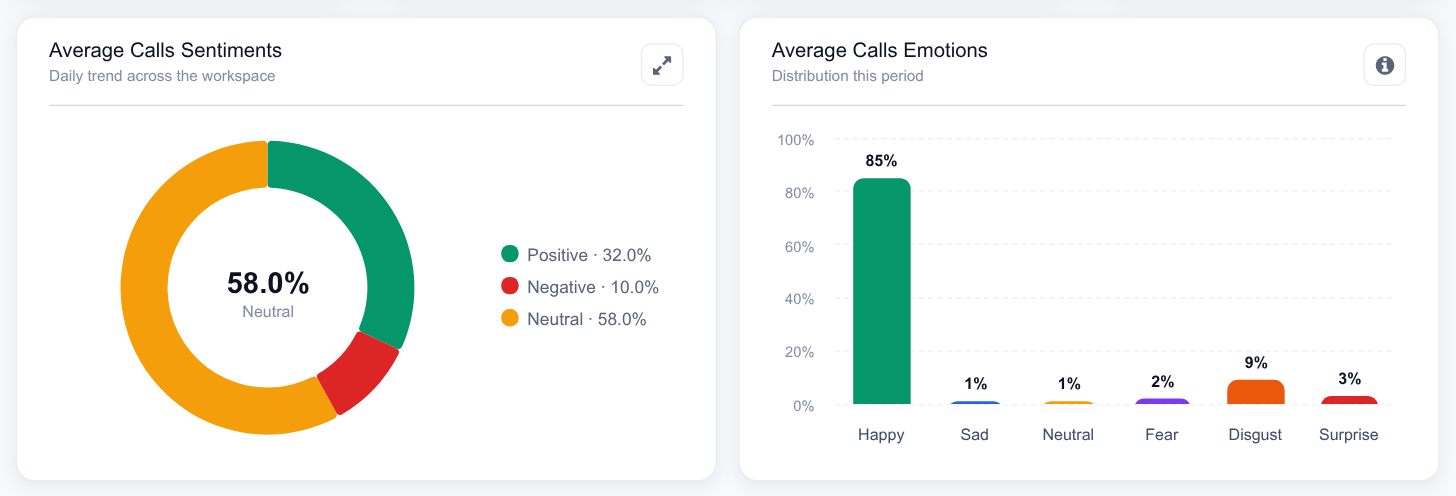
- Average Calls Sentiments Daily sentiment trend across the workspace — the shape to watch after a script change or a new campaign. The expand icon opens it full-size.
- Average Calls Emotions Distribution across the six audio emotions — happy, sad, neutral, fear, disgust, surprise. The benchmark control compares the mix against the emotion targets set on the workspace.
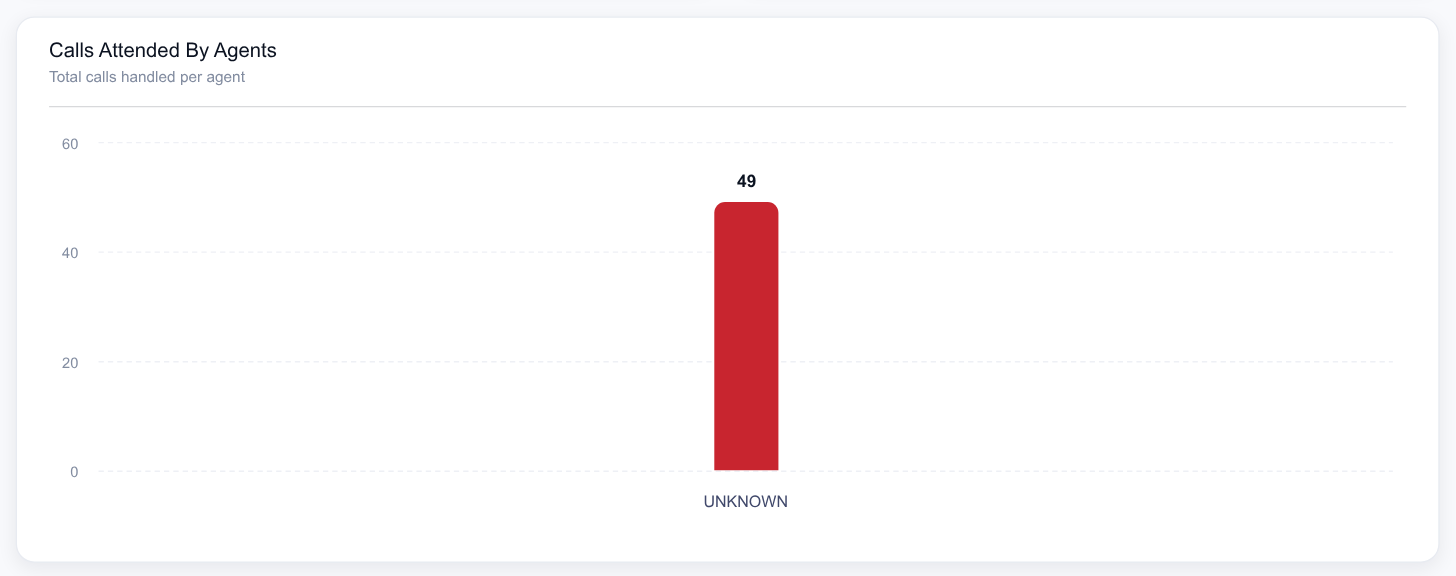
- Calls Attended By Agents Total calls handled per agent in the range — volume balance across the floor, and the quickest way to spot an agent whose calls stopped arriving.
For charts you define yourself — flags, quadrants, longer windows — see Analytics.
Recent Calls table
| Column | What it shows |
|---|---|
| Audio File | Filename plus the call ID, with a copy button — the ID is what you quote to support or paste into a search. |
| Agent | The agent the call is attributed to. |
| Sentiment | Overall sentiment as a colour dial: green positive, amber neutral, red negative. |
| Duration | Length in minutes. Shown in red when it exceeds the workspace’s average-duration goal. |
| Date | Call date. |
| Actions | Bookmark, Preview (opens the full call analysis) and Update Metadata. |
Rows are paginated at the bottom of the card, and the page you were on is remembered as you move around.
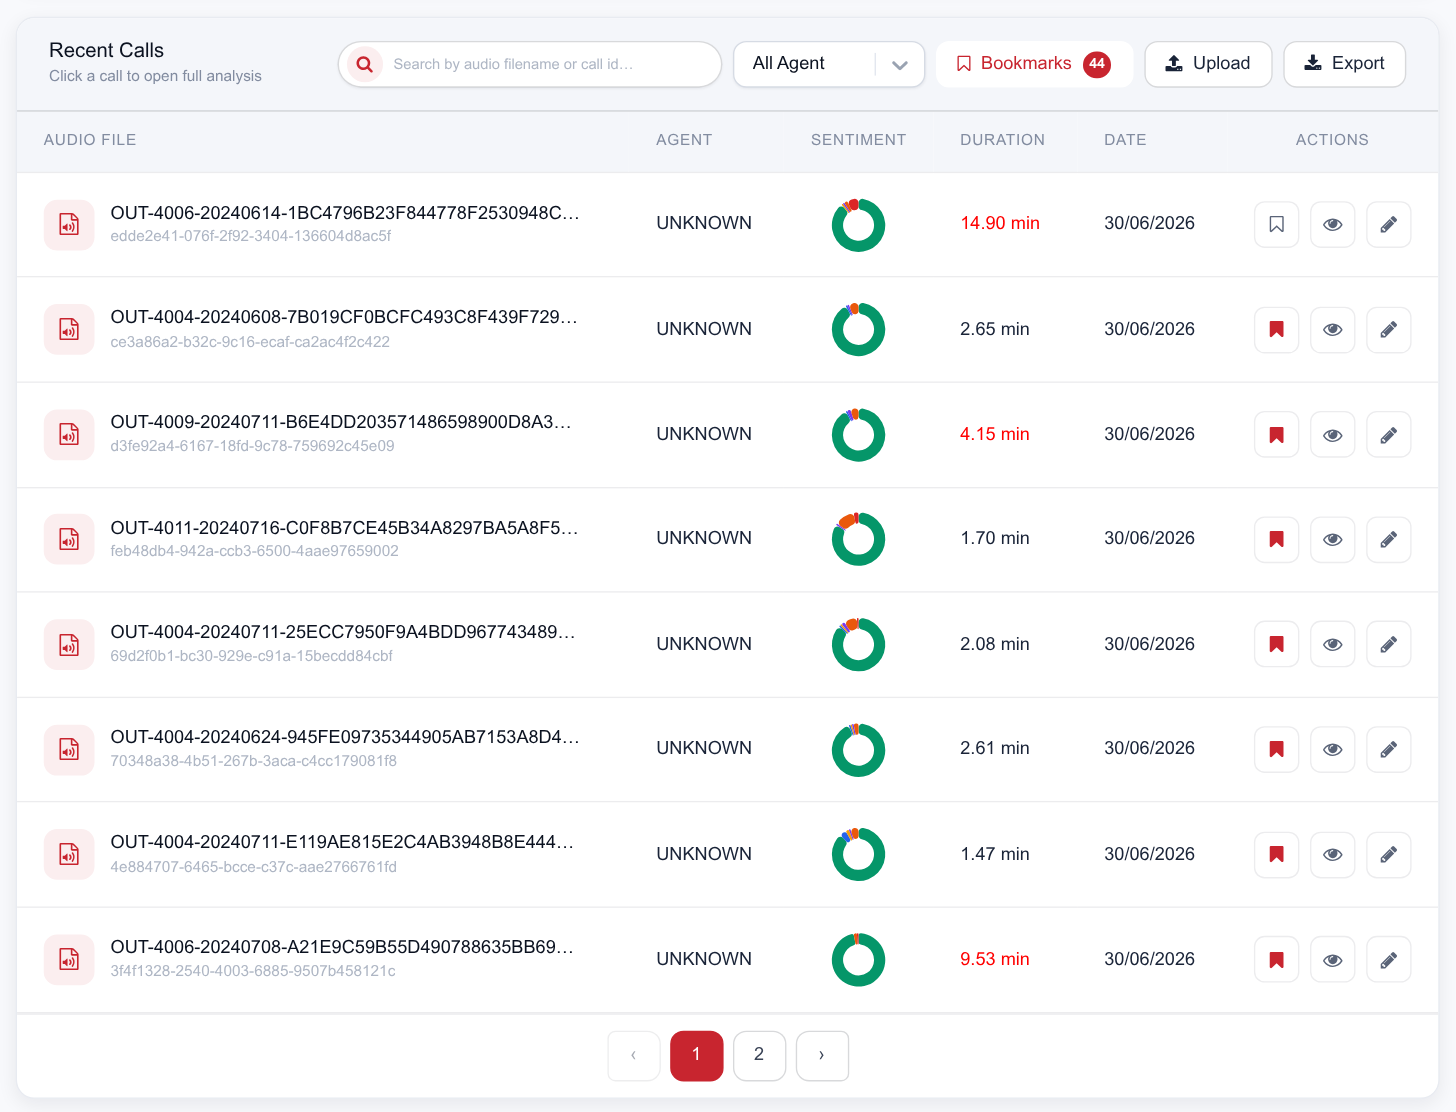
Search and Agent filter
- Search matches on audio filename or call ID. It’s debounced — type and the list catches up on its own.
- Select Agent narrows the list to one agent; All Agent returns to everyone.
- Both compose with the date range and any advanced filter you have applied.
Bookmarks
The bookmark icon on a row marks a call for follow-up; the Bookmarks button in the table header — with a count badge — switches the list to only those calls. It’s the lightest way to build a coaching set: work down the negative-sentiment calls, bookmark the ones worth a conversation, then review just those with the supervisor. Bookmarks are per user and scoped to the date range in view.
Advanced filters
The filter panel builds conditions against any field the platform holds for a call — including the metadata you upload yourself.
The panel opens as a drawer down the right-hand side, and reads top to bottom in three parts.
-
Pick a filter type and audio type
The first selector decides which set of fields is available; the second narrows it. Give the
filter a title here too if you intend to save it.
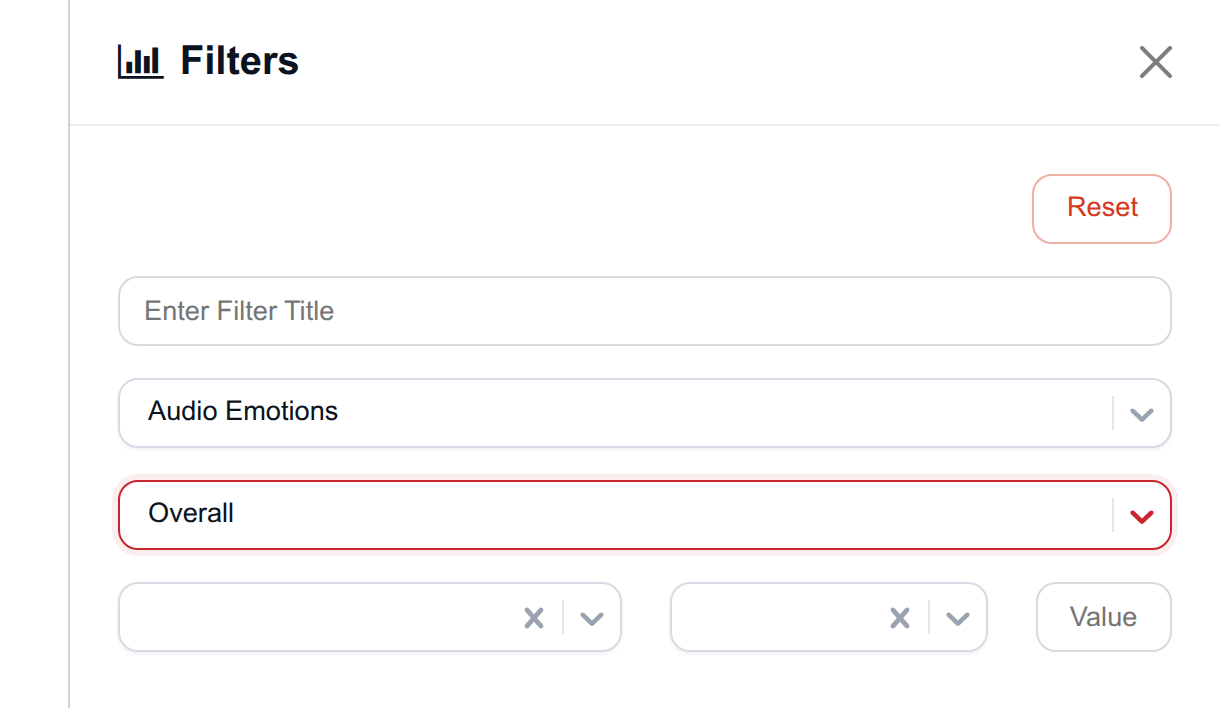
Title, metric, sub-metric, then the condition row. Reset clears the form without closing the drawer. - Build a condition Choose the field, an operator, and a value — the third row above. Where a field is channel-specific, the channel (agent or customer) comes with it.
-
Add more conditions, then apply
Each additional row joins with AND or OR, so you can express
"negative sentiment AND duration over 6 minutes". Apply updates the call
list, counts and pagination; Save keeps the filter for reuse.

AND / OR chain another row onto the same filter. Apply runs it; Save keeps it.
Beneath the builder, the same drawer holds the filters you and your colleagues have already saved.
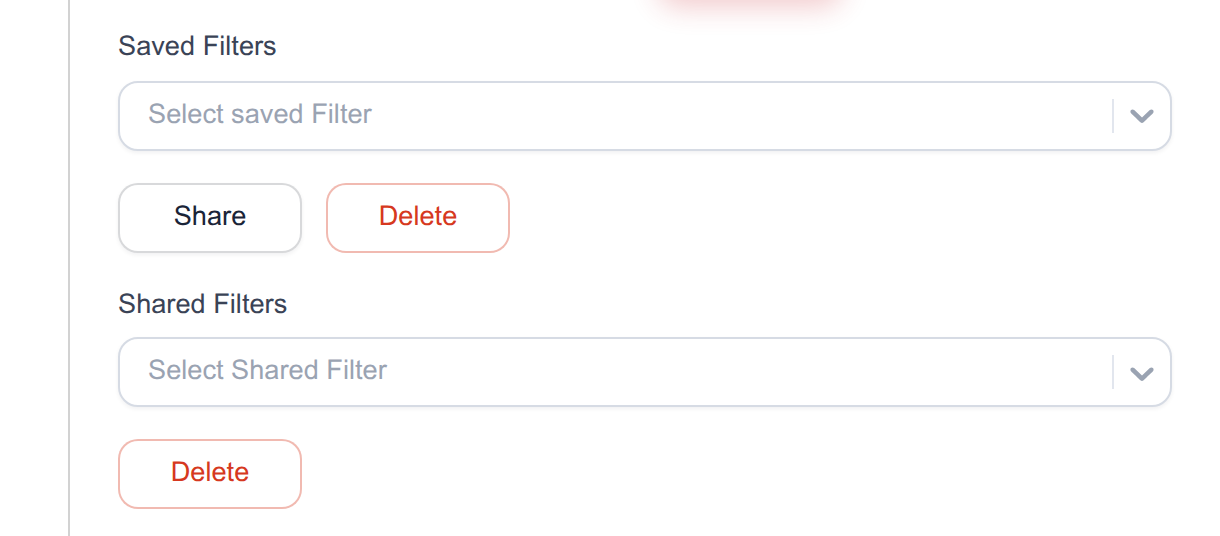
Clear the applied filter from the panel to return to the unfiltered list.
Clear the applied filter from the panel to return to the unfiltered list.
Saved and Shared filters
- Save a filter you’ve built and give it a name — it then appears in the Saved filter dropdown in the toolbar for one-click reuse.
- Share a saved filter with colleagues; it shows up in their Shared Filters list. Handy for standardising what your QA team reviews each morning.
- Delete removes a saved or shared filter you own.
Metadata import and export
- Export — downloads the current call list, including metadata, as a spreadsheet.
- Upload — takes a filled-in spreadsheet back and applies metadata to those calls in bulk.
- Update Metadata (row pencil) — edits one call’s fields inline.
Both controls sit in the Recent Calls header, next to Bookmarks — see the Recent Calls table above. Neither opens a screen of its own: Export downloads the spreadsheet straight away, and Upload opens your operating system’s file picker.
What agents see
When someone signs in with the Agent role, the dashboard narrows to their own calls and their own charts. The agent selector, bookmarks, metadata tools, advanced filters and comment tab are not shown, and agents granted only Performance Access land on Agents Performance instead of the dashboard. See agent access levels.